Perf
September 09, 2015
Perf overview
Perf is a facility comprised of kernel infrastructure for gathering various events and userspace tool to get gathered data from the kernel and analyze it. It is like a gprof, but it is non-invasive, low-overhead and profile the whole stack, including your app, libraries, system calls AND kernel with CPU!
The perf tool supports a list of measurable events that you can view with
perf list command. The tool and underlying kernel interface can measure events
coming from different sources. For instance, some events are pure kernel
counters, in this case, they are called software events. Examples include
context-switches, minor-faults, page-faults and others.
Another source of events is the processor itself and its Performance Monitoring Unit (PMU). It provides a list of events to measure micro-architectural events such as the number of cycles, instructions retired, L1 cache misses and so on. Those events are called “PMU hardware events” or “hardware events” for short. They vary with each processor type and model - look at this Vince Weaver’s perf page for details
The “perf_events” interface also provides a small set of common hardware events monikers. On each processor, those events get mapped onto actual events provided by the CPU if they exist, otherwise, the event cannot be used. Somewhat confusingly, these are also called hardware events and hardware cache events.
Finally, there are also tracepoint events which are implemented by the kernel ftrace infrastructure. Those are only available with the 2.6.3x and newer kernels.
Thanks to such a variety of events and analysis abilities of userspace tool (see
below) perf is a big fish in the world of tracing and profiling of Linux
systems. It is a really versatile tool that may be used in several ways of
which I know a few:
- Record a profile and analyze it later:
perf record+perf report - Gather statistics for application or system:
perf stat - Real-time function-wise analysis:
perf top - Trace application or system:
perf trace
Each of these approaches includes a tremendous amount of possibilities for sorting, filtering, grouping and so on.
But as someone said, perf is a powerful tool with a little documentation. So
in this article, I’ll try to share some of my knowledge about it.
Basic perf workflows
Preflight check
The first thing to do when you start working with Perf is to launch perf test.
This will check your system and kernel features and report if something isn’t
available. Usually, you need to make as much as possible “OK"s. Beware though
that perf will behave differently when launched under “root” and ordinary
user. It’s smart enough to let you do some things without root privileges.
There is a control file at “/proc/sys/kernel/perf_event_paranoid” that you can
tweak in order to change access to perf events:
$ perf stat -a
Error:
You may not have permission to collect system-wide stats.
Consider tweaking /proc/sys/kernel/perf_event_paranoid:
 -1 - Not paranoid at all
  0 - Disallow raw tracepoint access for unpriv
  1 - Disallow cpu events for unpriv
  2 - Disallow kernel profiling for unpriv
After you played with perf test, you can see what hardware events are available
to you with perf list. Again, the list will differ depending on current user
id. Also, a number of events will depend on your hardware: x86_64 CPUs have
much more hardware events than some low-end ARM processors.
System statistics
Now to some real profiling. To check the general health of your system you can
gather statistics with perf stat.
# perf stat -a sleep 5

 Performance counter stats for 'system wide':

      20005.830934      task-clock (msec)         #    3.999 CPUs utilized            (100.00%)
             4,236      context-switches          #    0.212 K/sec                    (100.00%)
               160      cpu-migrations            #    0.008 K/sec                    (100.00%)
             2,193      page-faults               #    0.110 K/sec
     2,414,170,118      cycles                    #    0.121 GHz                      (83.35%)
     4,196,068,507      stalled-cycles-frontend   #  173.81% frontend cycles idle     (83.34%)
     3,735,211,886      stalled-cycles-backend    #  154.72% backend  cycles idle     (66.68%)
     2,109,428,612      instructions              #    0.87  insns per cycle
                                                  #    1.99  stalled cycles per insn  (83.34%)
       406,168,187      branches                  #   20.302 M/sec                    (83.32%)
         6,869,950      branch-misses             #    1.69% of all branches          (83.32%)

       5.003164377 seconds time elapsed
Here you can see how many context switches, migrations, page faults and other
events happened during 5 seconds, along with some simple calculations. In fact,
perf tool highlight statistics that you should worry about. In my case, it’s a
stalled-cycles-frontend/backend. This counter shows how much time CPU pipeline
is stalled (i.e. not advanced) due to some external cause like waiting for
memory access.
Along with perf stat you have perf top - a top like utility, but that works
symbol-wise.
# perf top -a --stdio

PerfTop:     361 irqs/sec  kernel:35.5%  exact:  0.0% [4000Hz cycles],  (all, 4 CPUs)
----------------------------------------------------------------------------------------

 2.06%  libglib-2.0.so.0.4400.1     [.] g_mutex_lock
 1.99%  libglib-2.0.so.0.4400.1     [.] g_mutex_unlock
 1.47%  [kernel]                    [k] __fget
 1.34%  libpython2.7.so.1.0         [.] PyEval_EvalFrameEx
 1.07%  [kernel]                    [k] copy_user_generic_string
 1.00%  libpthread-2.21.so          [.] pthread_mutex_lock
 0.96%  libpthread-2.21.so          [.] pthread_mutex_unlock
 0.85%  libc-2.21.so                [.] _int_malloc
 0.83%  libpython2.7.so.1.0         [.] PyParser_AddToken
 0.82%  [kernel]                    [k] do_sys_poll
 0.81%  libQtCore.so.4.8.6          [.] QMetaObject::activate
 0.77%  [kernel]                    [k] fput
 0.76%  [kernel]                    [k] __audit_syscall_exit
 0.75%  [kernel]                    [k] unix_stream_recvmsg
 0.63%  [kernel]                    [k] ia32_sysenter_target
Here you can see kernel functions, glib library functions, CPython functions, Qt framework functions and a pthread functions combined with its overhead. It’s a great tool to peek into system state to see what’s going on.
Application profiling
To profile particular application, either already running or not, you use perf record to collect events and then perf report to analyze program behavior.
Let’s see:
# perf record -bag updatedb
[ perf record: Woken up 259 times to write data ]
[ perf record: Captured and wrote 65.351 MB perf.data (127127 samples) ]
Now dive into data with perf report:
# perf report
You will see a nice interactive TUI interface.
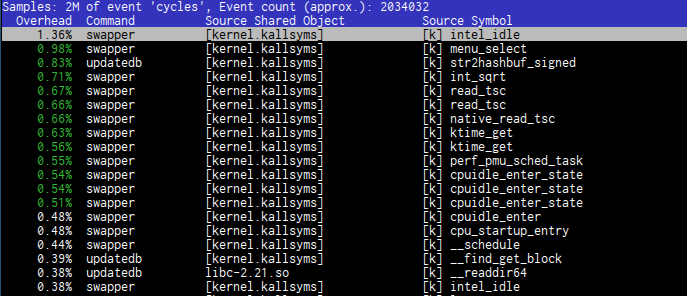
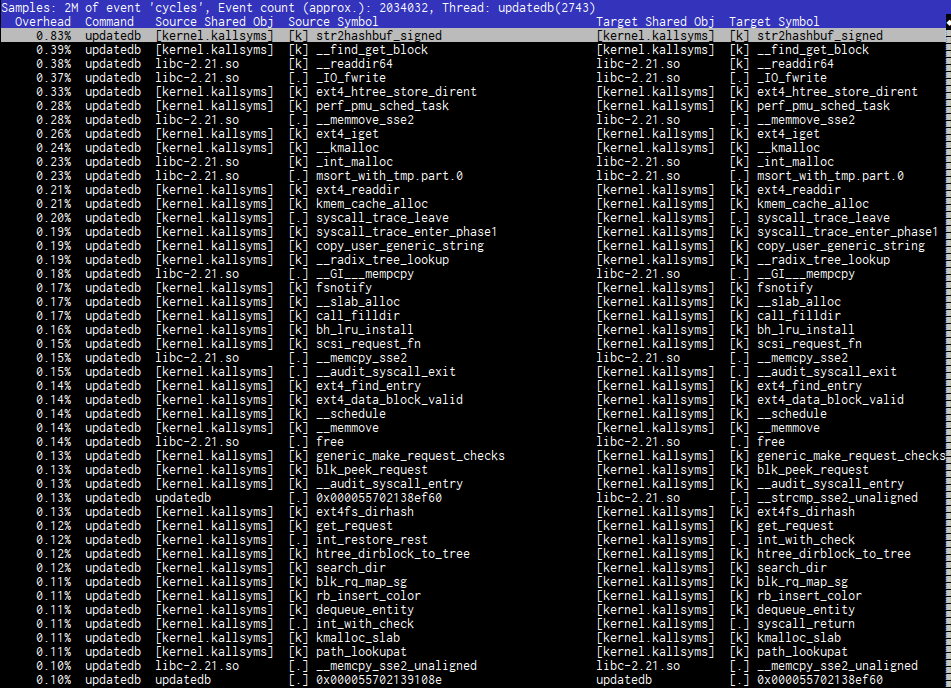
You can zoom into pid/thread
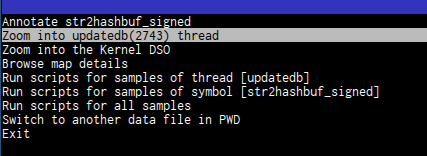
and see what’s going on there
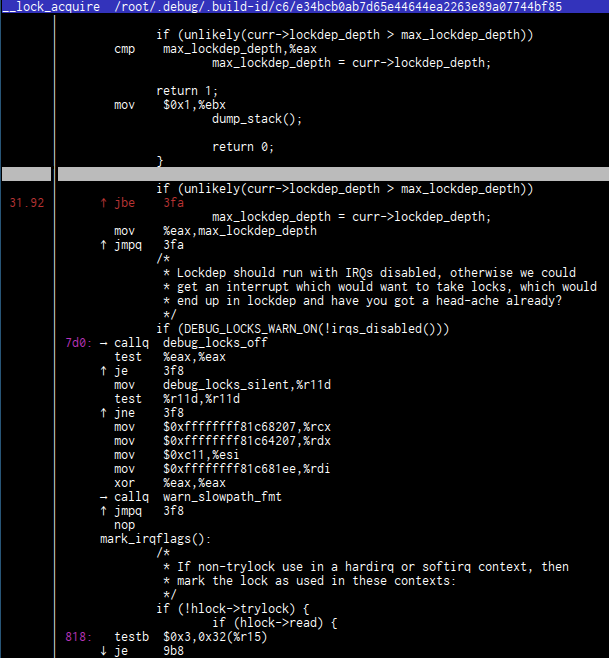
You can look into nice assembly code (this looks almost as in radare)
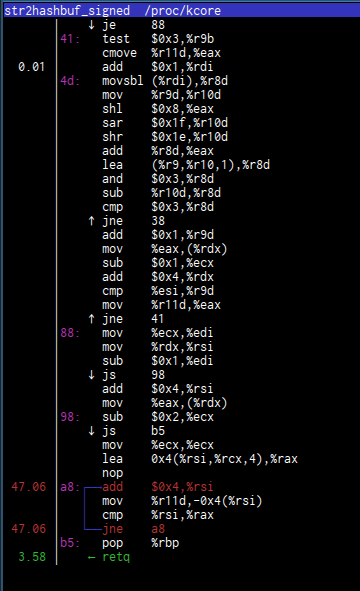
and run scripts on it to see, for example, function calls histogram:
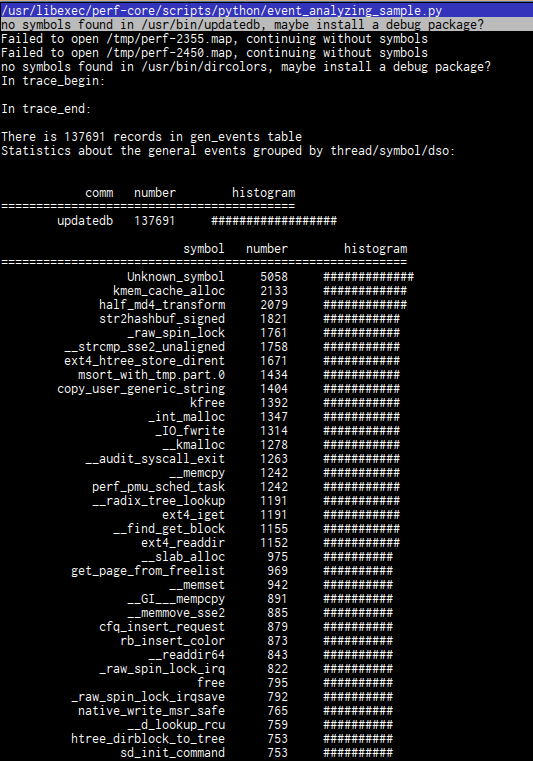
If it’s not enough to you, there are a lot of options both for perf record and
perf report so play with it.
Other
In addition to that, you can find tools to profile kernel memory subsystem, locking, kvm guests, scheduling, do benchmarking and even create timecharts.
For illustration I’ll profile my simple block_hasher utility. Previously, I’ve profiled it with gprof and gcov, Valgrind and ftrace.
Hot spots profiling
When I was profiling my block_hasher util with gprof and gcov I didn’t see anything special related to application
code, so I assume that it’s not an application code that makes it slow. Let’s
see if perf can help us.
Start with perf stat giving options for detailed and scaled counters for CPU ("-dac”)
# perf stat -dac ./block_hasher -d /dev/md0 -b 1048576 -t 10 -n 1000

 Performance counter stats for 'system wide':

      32978.276562      task-clock (msec)         #    4.000 CPUs utilized            (100.00%)
             6,349      context-switches          #    0.193 K/sec                    (100.00%)
               142      cpu-migrations            #    0.004 K/sec                    (100.00%)
             2,709      page-faults               #    0.082 K/sec
    20,998,366,508      cycles                    #    0.637 GHz                      (41.08%)
    23,007,780,670      stalled-cycles-frontend   #  109.57% frontend cycles idle     (37.50%)
    18,687,140,923      stalled-cycles-backend    #   88.99% backend  cycles idle     (42.64%)
    23,466,705,987      instructions              #    1.12  insns per cycle
                                                  #    0.98  stalled cycles per insn  (53.74%)
     4,389,207,421      branches                  #  133.094 M/sec                    (55.51%)
        11,086,505      branch-misses             #    0.25% of all branches          (55.53%)
     7,435,101,164      L1-dcache-loads           #  225.455 M/sec                    (37.50%)
       248,499,989      L1-dcache-load-misses     #    3.34% of all L1-dcache hits    (26.52%)
       111,621,984      LLC-loads                 #    3.385 M/sec                    (28.77%)
   <not supported>      LLC-load-misses:HG

       8.245518548 seconds time elapsed
Well, nothing really suspicious. 6K page context switches is OK because my
machine is 2-core and I’m running 10 threads. 2K page faults is fine since we’re
reading a lot of data from disks. Big stalled-cycles-frontend/backend is kind of
outliers here since it’s still big on simple ls and --per-core statistics
shows 0.00% percents of stalled-cycles.
Let’s collect profile:
# perf record -a -g -s -d -b ./block_hasher -d /dev/md0 -b 1048576 -t 10 -n 1000
[ perf record: Woken up 73 times to write data ]
[ perf record: Captured and wrote 20.991 MB perf.data (33653 samples) ]
Options are:
- -a for all CPUs
- -g for call graphs
- -s for per thread count
- -d for sampling addresses. Not sure about this one, but it doesn’t affect profile
- -b for sample any taken branches
Now show me the profile:
# perf report -g -T
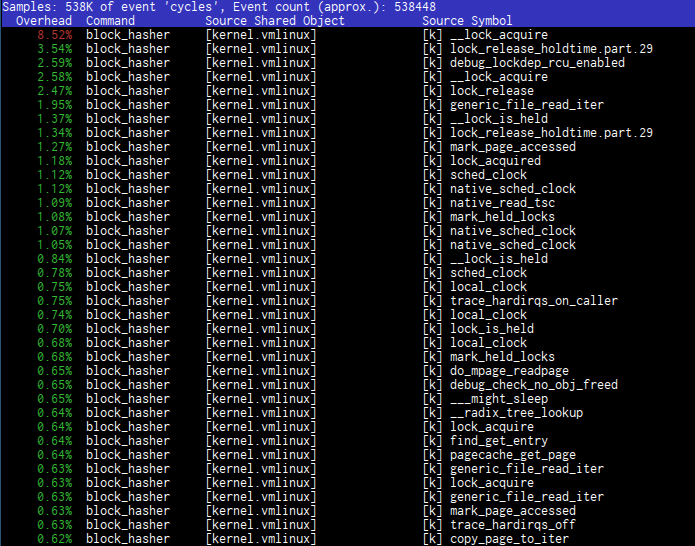
Nothing much. I’ve looked into block_hasher threads, I’ve built a histogram, looked for vmlinux DSO, found instruction with most overhead
and still can’t say I found what’s wrong. That’s because there is no real overhead, nothing is spinning in vain. Something is just plain sleeping.
What we’ve done here and before in ftrace part
is a hot spots analysis, i.e. we try to find places in our application or system
that cause CPU to spin in useless cycles. Usually, it’s what you want but not
today. We need to understand why pread is sleeping. And that’s what I call
“latency profiling”.
Latency profiling
Record sched_stat and sched_switch events
When you search for perf documentation, the first thing you find is “Perf tutorial”. The “perf tutorial” page is almost entirely dedicated to the “hot spots” scenario, but, fortunately, there is an “Other scenarios” section with “Profiling sleep times” tutorial.
Profiling sleep times
This feature shows where and how long a program is sleeping or waiting something.
Whoa, that’s what we need!
Unfortunately scheduling stats profiling is not working by default.
perf inject failing with
# perf inject -v -s -i perf.data.raw -o perf.data
registering plugin: /usr/lib64/traceevent/plugins/plugin_kmem.so
registering plugin: /usr/lib64/traceevent/plugins/plugin_mac80211.so
registering plugin: /usr/lib64/traceevent/plugins/plugin_function.so
registering plugin: /usr/lib64/traceevent/plugins/plugin_hrtimer.so
registering plugin: /usr/lib64/traceevent/plugins/plugin_sched_switch.so
registering plugin: /usr/lib64/traceevent/plugins/plugin_jbd2.so
registering plugin: /usr/lib64/traceevent/plugins/plugin_cfg80211.so
registering plugin: /usr/lib64/traceevent/plugins/plugin_scsi.so
registering plugin: /usr/lib64/traceevent/plugins/plugin_xen.so
registering plugin: /usr/lib64/traceevent/plugins/plugin_kvm.so
overriding event (263) sched:sched_switch with new print handler
build id event received for [kernel.kallsyms]:
8adbfad59810c80cb47189726415682e0734788a
failed to write feature 2
The reason is that it can’t find in build-id cache scheduling stats symbols because CONFIG_SCHEDSTATS is disabled because it introduces some “non-trivial performance impact for context switches”. Details in Red Hat bugzilla Bug 1026506 and Bug 1013225. Debian kernels also don’t enable this option.
You can recompile kernel enabling “Collect scheduler statistics” in make menuconfig, but happy Fedora users can just install
debug kernel:
dnf install kernel-debug kernel-debug-devel kernel-debug-debuginfo
Now, when everything works, we can give it a try:
# perf record -e sched:sched_stat_sleep -e sched:sched_switch  -e sched:sched_process_exit -g -o perf.data.raw ./block_hasher -d /dev/md0 -b 1048576 -t 10 -n 1000
[ perf record: Woken up 1 times to write data ]
[ perf record: Captured and wrote 0.564 MB perf.data.raw (2001 samples) ]

# perf inject -v -s -i perf.data.raw -o perf.data.sched
registering plugin: /usr/lib64/traceevent/plugins/plugin_kmem.so
registering plugin: /usr/lib64/traceevent/plugins/plugin_mac80211.so
registering plugin: /usr/lib64/traceevent/plugins/plugin_function.so
registering plugin: /usr/lib64/traceevent/plugins/plugin_hrtimer.so
registering plugin: /usr/lib64/traceevent/plugins/plugin_sched_switch.so
registering plugin: /usr/lib64/traceevent/plugins/plugin_jbd2.so
registering plugin: /usr/lib64/traceevent/plugins/plugin_cfg80211.so
registering plugin: /usr/lib64/traceevent/plugins/plugin_scsi.so
registering plugin: /usr/lib64/traceevent/plugins/plugin_xen.so
registering plugin: /usr/lib64/traceevent/plugins/plugin_kvm.so
overriding event (266) sched:sched_switch with new print handler
build id event received for /usr/lib/debug/lib/modules/4.1.6-200.fc22.x86_64+debug/vmlinux: c6e34bcb0ab7d65e44644ea2263e89a07744bf85
Using /root/.debug/.build-id/c6/e34bcb0ab7d65e44644ea2263e89a07744bf85 for symbols
But it’s really disappointing, I’ve expanded all callchains to see nothing:
# perf report --show-total-period -i perf.data.sched
Samples: 10  of event 'sched:sched_switch', Event count (approx.): 31403254575
  Children      Self        Period  Command       Shared Object                           Symbol
-  100.00%     0.00%             0  block_hasher  libpthread-2.21.so                      [.] pthread_join
   - pthread_join
        0
-  100.00%     0.00%             0  block_hasher  e34bcb0ab7d65e44644ea2263e89a07744bf85  [k] system_call
     system_call
   - pthread_join
        0
-  100.00%     0.00%             0  block_hasher  e34bcb0ab7d65e44644ea2263e89a07744bf85  [k] sys_futex
     sys_futex
     system_call
   - pthread_join
        0
-  100.00%     0.00%             0  block_hasher  e34bcb0ab7d65e44644ea2263e89a07744bf85  [k] do_futex
     do_futex
     sys_futex
     system_call
   - pthread_join
        0
-  100.00%     0.00%             0  block_hasher  e34bcb0ab7d65e44644ea2263e89a07744bf85  [k] futex_wait
     futex_wait
     do_futex
     sys_futex
     system_call
   - pthread_join
        0
-  100.00%     0.00%             0  block_hasher  e34bcb0ab7d65e44644ea2263e89a07744bf85  [k] futex_wait_queue_me
     futex_wait_queue_me
     futex_wait
     do_futex
     sys_futex
     system_call
   - pthread_join
        0
-  100.00%     0.00%             0  block_hasher  e34bcb0ab7d65e44644ea2263e89a07744bf85  [k] schedule
     schedule
     futex_wait_queue_me
     futex_wait
     do_futex
     sys_futex
     system_call
   - pthread_join
        0
-  100.00%   100.00%   31403254575  block_hasher  e34bcb0ab7d65e44644ea2263e89a07744bf85  [k] __schedule
     __schedule
     schedule
     futex_wait_queue_me
     futex_wait
     do_futex
     sys_futex
     system_call
   - pthread_join
        0
-   14.52%     0.00%             0  block_hasher  [unknown]                               [.] 0000000000000000
     0
perf sched
Let’s see what else can we do. There is a perf sched command that has
latency subcommand to “report the per task scheduling latencies and other
scheduling properties of the workload”. Why not give it a shot?
# perf sched record -o perf.sched -g ./block_hasher -d /dev/md0 -b 1048576 -t 10 -n 1000
[ perf record: Woken up 6 times to write data ]
[ perf record: Captured and wrote 13.998 MB perf.sched (56914 samples) ]

# perf report -i perf.sched
I’ve inspected samples for sched_switch and sched_stat_runtime events (15K
and 17K respectively) and found nothing. But then I looked in
sched_stat_iowait.
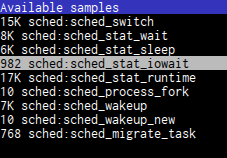
and there I found really suspicious thing:
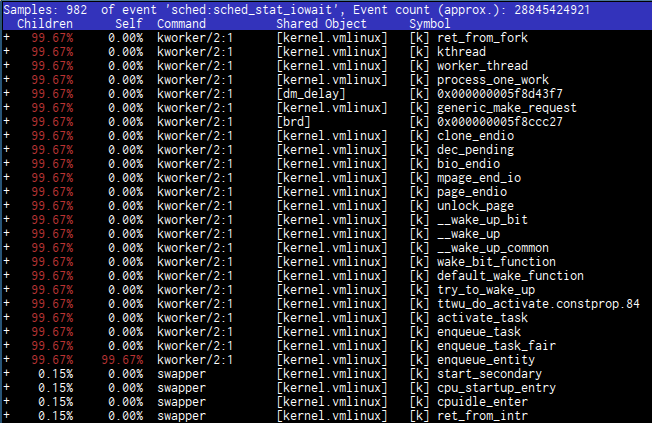
See? Almost all symbols come from “kernel.vmlinux” shared object, but one with strange name “0x000000005f8ccc27” comes from “dm_delay” object. Wait, what is “dm_delay”? Quick find gives us the answer:
> dm-delay
> ========
>
> Device-Mapper's "delay" target delays reads and/or writes
> and maps them to different devices.
WHAT?! Delays reads and/or writes? Really?
# dmsetup info
Name:              delayed
State:             ACTIVE
Read Ahead:        256
Tables present:    LIVE
Open count:        1
Event number:      0
Major, minor:      253, 0
Number of targets: 1

# dmsetup table
delayed: 0 1000000 delay 1:7 0 30

# udevadm info -rq name /sys/dev/block/1:7
/dev/ram7
So, we have block device “/dev/ram7” mapped to DeviceMapper “delay” target to, well, delay I/O requests to 30 milliseconds. That’s why the whole RAID was slow - the performance of RAID0 is performance of the slowest disk in RAID.
Of course, I knew it from the beginning. I just wanted to see if I’ll be able to
detect it with profiling tools. And in this case, I don’t think it’s fair to say
that perf helped. Actually, perf gives a lot of confusion in the interface.
Look at the picture above. What are these couple of dozens of lines with “99.67%”
tell us? Which of these symbols cause latency? How to interpret it? If I wasn’t
really attentive, like after a couple of hours of debugging and investigating, I
couldn’t be able to notice it. If I issued the magic perf inject command it
will collapse sched_stat_iowait command and I’ll not see dm-delay in top
records.
Again, this is all are very confusing and it’s just a fortune that I’ve noticed it.
Conclusion
Perf is really versatile and extremely complex tool with a little documentation. On some simple cases it will help you a LOT. But a few steps from the mainstream problems and you are left alone with unintuitive data. We all need various documentation on perf - tutorials, books, slides, videos - that not only scratch the surface of it but gives a comprehensive overview of how it works, what it can do and what it doesn’t. I hope I have contributed to that purpose with this article (it took me half a year to write it).