Instrumenting a Go service for Prometheus
February 03, 2018
I’m the big proponent of the DevOps practices and always been keen to operate things I’ve developed. That’s why I’m really excited about DevOps, SRE, Observability, Service Discovery and other great things which I believe will transform our industry to be truly software engineering. In this blog I’m trying to (among other cool stuff I’m doing) share examples of how you can help yourself or your grumpy Ops guys to operate your service. Last time we developed a typical web service, serving a data from key-value storage, and added Consul integration into it for Service Discovery. This time we are going to instrument our code for monitoring.
Why instrument?
At first, you may wonder why should we instrument our code, why not collect metrics needed for the monitoring from the outside like just install Zabbix agent or setup Nagios checks? There is nothing really wrong with that solution where you treat monitoring targets as black boxes. Though there is another way to do that – white-box monitoring – where your services provide metrics themselves as a result of instrumentation. It’s not really about choosing only one way of doing things – both of these solutions may, and should, supplement each other. For example, you may treat your database servers as a black box providing metrics such as available memory, while instrumenting your database access layer to measure DB request latency.
It’s all about different points of view and it was discussed in Google’s SRE book:
The simplest way to think about black-box monitoring versus white-box monitoring is that black-box monitoring is symptom-oriented and represents active—not predicted—problems: “The system isn’t working correctly, right now.” White-box monitoring depends on the ability to inspect the innards of the system, such as logs or HTTP endpoints, with instrumentation. White-box monitoring, therefore, allows detection of imminent problems, failures masked by retries, and so forth. … When collecting telemetry for debugging, white-box monitoring is essential. If web servers seem slow on database-heavy requests, you need to know both how fast the web server perceives the database to be, and how fast the database believes itself to be. Otherwise, you can’t distinguish an actually slow database server from a network problem between your web server and your database.
My point is that to gain a real observability of your system you should supplement your existing black-box monitoring with a white-box by instrumenting your services.
What to instrument
Now, after we convinced that instrumenting is a good thing let’s think about what to monitor. A lot of people say that you should instrument everything you can, but I think it’s over-engineering and you should instrument for things that really matter to avoid codebase complexity and unnecessary CPU cycles in your service for collecting the bloat of metrics.
So what are those things that really matter that we should instrument for? Well, the same SRE book defines the so-called four golden signals of monitoring:
- Traffic or Request Rate
- Errors
- Latency or Duration of the requests
- Saturation
Out of these 4 signals, saturation is the most confusing because it’s not clear how to measure it or if it’s even possible in a software system. I see saturation mostly for the hardware resources which I’m not going to cover here, check the Brendan Gregg’s USE method for this.
Because saturation is hard to measure in a software system, there is a service tailored version of 4 golden signals which is called “the RED method”, which lists 3 metrics:
- Request rate
- Errors
- Duration (latency) distribution
That’s what we’ll instrument for in the webkv service.
We will use Prometheus to monitor our service because it’s go-to tool for monitoring these days – it’s simple, easy to setup and fast. We will need Prometheus Go client library for instrumenting our code.
Instrumenting HTTP handlers
Prometheus works by pulling data from /metrics HTTP handler that serves metrics in a simple text-based exposition format so we need to calculate RED metrics and export it via a dedicated endpoint.
Luckily, all of these metrics can be easily exported with an InstrumentHandler helper.
diff --git a/webkv.go b/webkv.go
index 94bd025..f43534f 100644
--- a/webkv.go
+++ b/webkv.go
@@ -9,6 +9,7 @@ import (
        "strings"
        "time"

+       "github.com/prometheus/client_golang/prometheus"
        "github.com/prometheus/client_golang/prometheus/promhttp"

        "github.com/alexdzyoba/webkv/service"
@@ -32,7 +33,7 @@ func main() {
        if err != nil {
                log.Fatal(err)
        }
-       http.Handle("/", s)
+       http.Handle("/", prometheus.InstrumentHandler("webkv", s))
        http.Handle("/metrics", promhttp.Handler())

        l := fmt.Sprintf(":%d", *port)
and now to export the metrics via /metrics endpoint just add another 2 lines:
diff --git a/webkv.go b/webkv.go
index 1b2a9d7..94bd025 100644
--- a/webkv.go
+++ b/webkv.go
@@ -9,6 +9,8 @@ import (
        "strings"
        "time"

+       "github.com/prometheus/client_golang/prometheus/promhttp"
+
        "github.com/alexdzyoba/webkv/service"
 )

@@ -31,6 +33,7 @@ func main() {
                log.Fatal(err)
        }
        http.Handle("/", s)
+       http.Handle("/metrics", promhttp.Handler())

        l := fmt.Sprintf(":%d", *port)
        log.Print("Listening on ", l)
And that’s it!
No, seriously, that’s all you need to do to make your service observable. It’s so nice and easy that you don’t have excuses for not doing it.
InstrumentHandler conveniently wraps your handler and export the following metrics:
http_request_duration_microsecondssummary with 50, 90 and 99 percentileshttp_request_size_bytessummary with 50, 90 and 99 percentileshttp_response_size_bytessummary with 50, 90 and 99 percentileshttp_requests_totalcounter labeled by status code and handler
promhttp.Handler also exports Go runtime information like a number of goroutines and memory stats.
The point is that you export simple metrics that you can easily calculate on the service and everything else is done with Prometheus and its powerful query language PromQL.
Scraping metrics with Prometheus
Now you need to tell Prometheus about your services so it will start scraping them. We could’ve hard code our endpoint with static_configs pointing it to the ’localhost:8080’. But remember how we previously registered out service in Consul? Prometheus can discover targets for scraping from Consul for our service and any other services with a single job definition:
- job_name: 'consul'
  consul_sd_configs:
    - server: 'localhost:8500'
  relabel_configs:
    - source_labels: [__meta_consul_service]
      target_label: job
That’s the pure awesomeness of Service Discovery! Your ops buddy will thank you for that :-)
(relabel_configs is needed because otherwise all services would be scraped as
consul)
Check that Prometheus recognized new targets:
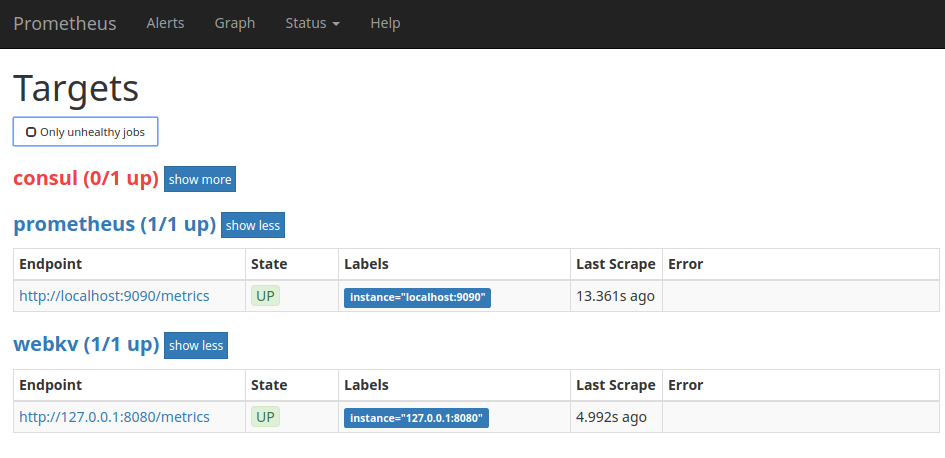
Yay!
The RED method metrics
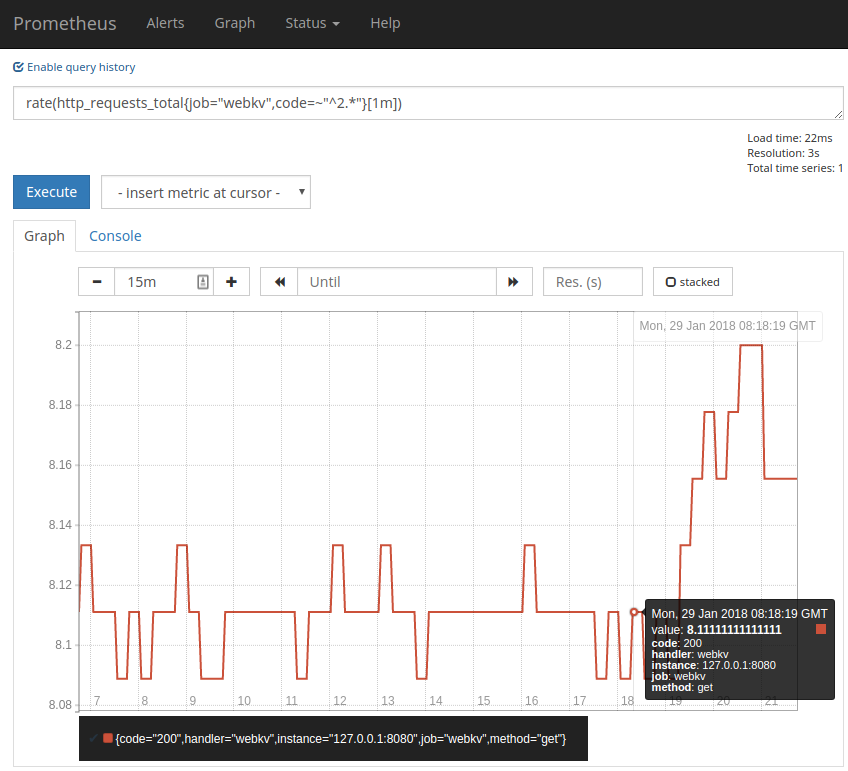
Now let’s calculate the metrics for the RED method. First one is the request rate and it can be calculated from http_requests_total metric like this:
rate(http_requests_total{job="webkv",code=~"^2.*"}[1m])
We filter HTTP request counter for the webkv job and successful HTTP status code, get a vector of values for the last 1 minute and then take a rate, which is basically a diff between first and last values. This gives us the amount of request that was successfully handled in the last minute. Because counter is accumulating we’ll never miss values even if some scrape failed.
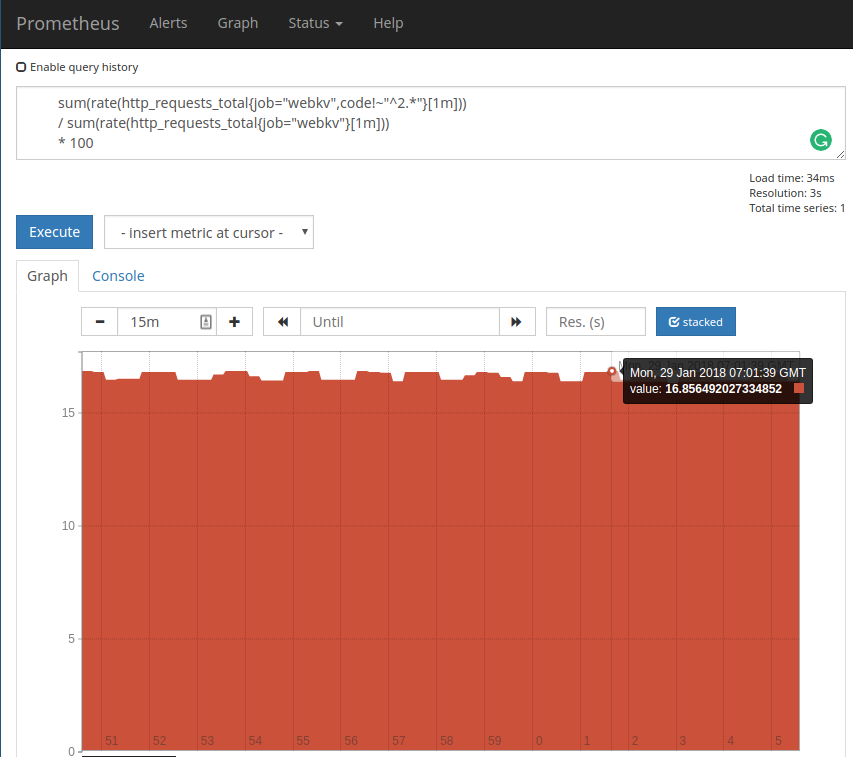
The second one is the errors that we can calculate from the same metric as a rate but what we actually want is a percentage of errors. This is how I calculate it:
sum(rate(http_requests_total{job=“webkv”,code!~"^2.*"}[1m])) / sum(rate(http_requests_total{job=“webkv”}[1m])) * 100
In this error query, we take the rate of error requests, that is the ones with non 2xx status code. This will give us multiple series for each status code like 404 or 500 so we need to sum them. Next, we do the same sum and rate but for all of the requests regardless of its status to get the overall request rate. And finally, we divide and multiply by 100 to get a percentage.
Finally, the latency distribution lies directly in http_request_duration_microseconds metric:
http_request_duration_microseconds{job="webkv"}
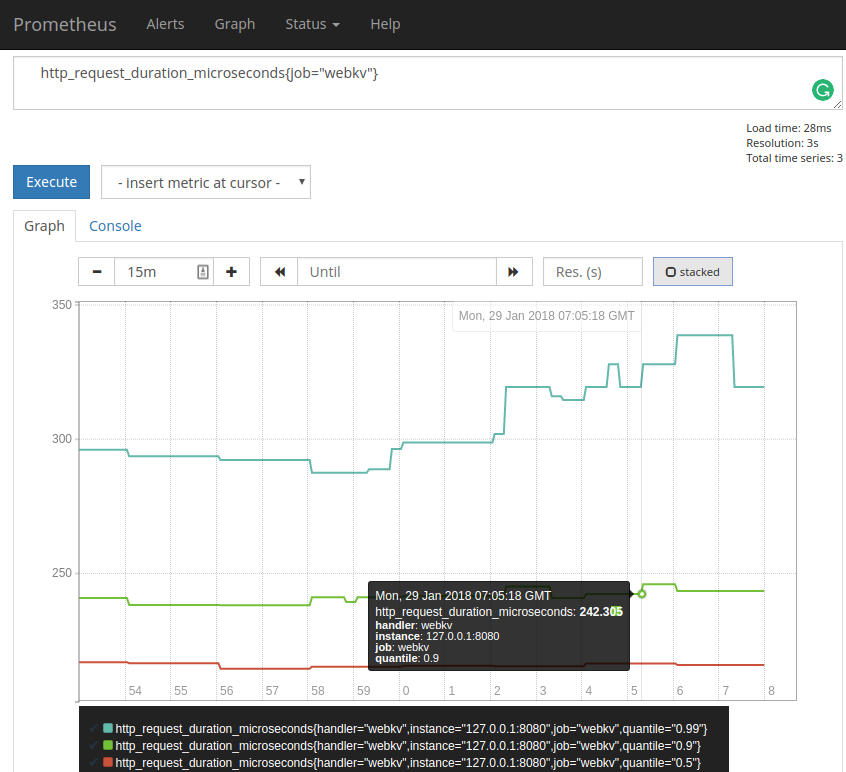
So that was easy and it’s more than enough for my simple service.
If you want to instrument for some custom metrics you can do it easily. I’ll show you how to do the same for the Redis requests that are made from the webkv handler. It’s not of a much use because there is a dedicated Redis exporter for Prometheus but, anyway, it’s just for the illustration.
Instrumenting for the custom metrics (Redis requests)
As you can see from the previous sections all we need to get the meaningful monitoring are just 2 metrics – a plain counter for HTTP request quantified on status code and a summary for request durations.
Let’s start with the counter. First, to make things nice, we define a new type Metrics with Prometheus CounterVec and add it to the Service struct:
--- a/service/service.go
+++ b/service/service.go
@@ -13,6 +14,7 @@ type Service struct {
        Port        int
        RedisClient redis.UniversalClient
        ConsulAgent *consul.Agent
+       Metrics     Metrics
 }
+
+type Metrics struct {
+       RedisRequests *prometheus.CounterVec
+}
+
Next, we must register our metric:
--- a/service/service.go
+++ b/service/service.go
@@ -28,6 +30,15 @@ func New(addrs []string, ttl time.Duration, port int) (*Service, error) {
                Addrs: addrs,
        })

+       s.Metrics.RedisRequests = prometheus.NewCounterVec(
+               prometheus.CounterOpts{
+                       Name: "redis_requests_total",
+                       Help: "How many Redis requests processed, partitioned by status",
+               },
+               []string{"status"},
+       )
+       prometheus.MustRegister(s.Metrics.RedisRequests)
+
        ok, err := s.Check()
        if !ok {
                return nil, err
We have created a variable of CounterVec type because plain Counter is for a single time series and we have a label for status, which makes it a vector of time series.
Finally, we need to increment the counter depending on the status:
--- a/service/redis.go
+++ b/service/redis.go
@@ -15,7 +15,9 @@ func (s *Service) ServeHTTP(w http.ResponseWriter, r *http.Request) {
        if err != nil {
                http.Error(w, "Key not found", http.StatusNotFound)
                status = 404
+               s.Metrics.RedisRequests.WithLabelValues("fail").Inc()
        }
+       s.Metrics.RedisRequests.WithLabelValues("success").Inc()

        fmt.Fprint(w, val)
        log.Printf("url=\"%s\" remote=\"%s\" key=\"%s\" status=%d\n",
Check, that it’s working:
$ curl -s 'localhost:8080/metrics' | grep redis
# HELP redis_requests_total How many Redis requests processed, partitioned by status
# TYPE redis_requests_total counter
redis_requests_total{status="fail"} 904
redis_requests_total{status="success"} 5433
Nice!
Calculating latency distribution is a little bit more involved because we have
to time our requests and put it in distribution buckets. Fortunately, there is a very nice prometheus.Timer helper to help measure time. As for the distribution buckets, Prometheus has a Summary type that does it automatically.
Ok, so first we have to register our new metric (adding it to our Metrics type):
--- a/service/service.go
+++ b/service/service.go
@@ -18,7 +18,8 @@ type Service struct {
 }

 type Metrics struct {
        RedisRequests  *prometheus.CounterVec
+       RedisDurations prometheus.Summary
 }

 func New(addrs []string, ttl time.Duration, port int) (*Service, error) {
@@ -39,6 +40,14 @@ func New(addrs []string, ttl time.Duration, port int) (*Service, error) {
        )
        prometheus.MustRegister(s.Metrics.RedisRequests)

+       s.Metrics.RedisDurations = prometheus.NewSummary(
+               prometheus.SummaryOpts{
+                       Name:       "redis_request_durations",
+                       Help:       "Redis requests latencies in seconds",
+                       Objectives: map[float64]float64{0.5: 0.05, 0.9: 0.01, 0.99: 0.001},
+               })
+       prometheus.MustRegister(s.Metrics.RedisDurations)
+
        ok, err := s.Check()
        if !ok {
                return nil, err
Our new metrics is just a Summary, not a SummaryVec because we have no labels. We defined 3 “objectives” – basically 3 buckets for calculating distribution – 50, 90 and 99 percentiles.
Here is how we measure request latency:
--- a/service/redis.go
+++ b/service/redis.go
@@ -5,12 +5,18 @@ import (
        "log"
        "net/http"
        "strings"
+
+       "github.com/prometheus/client_golang/prometheus"
 )

 func (s *Service) ServeHTTP(w http.ResponseWriter, r *http.Request) {
    status := 200

    key := strings.Trim(r.URL.Path, "/")
+
+   timer := prometheus.NewTimer(s.Metrics.RedisDurations)
+   defer timer.ObserveDuration()
+
    val, err := s.RedisClient.Get(key).Result()
    if err != nil {
            http.Error(w, "Key not found", http.StatusNotFound)
			status = 404
			s.Metrics.RedisRequests.WithLabelValues("fail").Inc()
		}
	s.Metrics.RedisRequests.WithLabelValues("success").Inc()

	fmt.Fprint(w, val)
	log.Printf("url=\"%s\" remote=\"%s\" key=\"%s\" status=%d\n",
		r.URL, r.RemoteAddr, key, status)
}
Yep, it’s that easy. You just create a new timer and defer it’s invocation so it will be invoked on the function exit. Although it will additionaly calculate a logging I’m okay with that.
By default, this timer measure time in seconds. To mimic http_request_duration_microseconds we can implement Observer interface that NewTimer accepts that does the calculation our way:
--- a/service/redis.go
+++ b/service/redis.go
@@ -14,7 +14,10 @@ func (s *Service) ServeHTTP(w http.ResponseWriter, r *http.Request) {

        key := strings.Trim(r.URL.Path, "/")

-       timer := prometheus.NewTimer(s.Metrics.RedisDurations)
+       timer := prometheus.NewTimer(prometheus.ObserverFunc(func(v float64) {
+               us := v * 1000000 // make microseconds
+               s.Metrics.RedisDurations.Observe(us)
+       }))
        defer timer.ObserveDuration()

        val, err := s.RedisClient.Get(key).Result()

--- a/service/service.go
+++ b/service/service.go
@@ -43,7 +43,7 @@ func New(addrs []string, ttl time.Duration, port int) (*Service, error) {
        s.Metrics.RedisDurations = prometheus.NewSummary(
                prometheus.SummaryOpts{
                        Name:       "redis_request_durations",
-                       Help:       "Redis requests latencies in seconds",
+                       Help:       "Redis requests latencies in microseconds",
                        Objectives: map[float64]float64{0.5: 0.05, 0.9: 0.01, 0.99: 0.001},
                })
        prometheus.MustRegister(s.Metrics.RedisDurations)
That’s it!
$ curl -s 'localhost:8080/metrics' | grep -P '(redis.*durations)'
# HELP redis_request_durations Redis requests latencies in microseconds
# TYPE redis_request_durations summary
redis_request_durations{quantile="0.5"} 207.17399999999998
redis_request_durations{quantile="0.9"} 230.399
redis_request_durations{quantile="0.99"} 298.585
redis_request_durations_sum 3.290851703000006e+06
redis_request_durations_count 15728
And now, when we have beautiful metrics let’s make a dashboard for them!
Grafana dashboard
It’s no secret, that once you have a Prometheus, you will eventually have Grafana to show dashboards for your metrics because Grafana has builtin support for Prometheus as a data source.
In my dashboard, I’ve just put our RED metrics and sprinkled some colors. Here is the final dashboard:
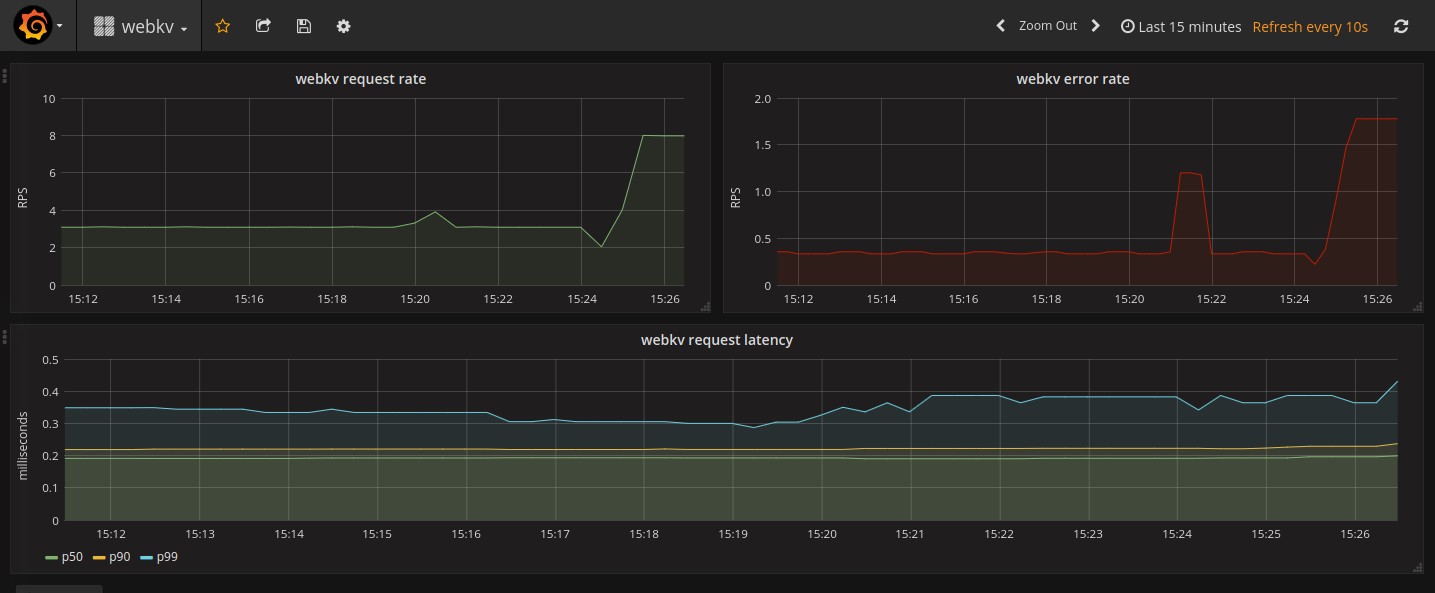
Note, that for latency graph, I’ve created 3 series for each of the 0.5, 0.9 and 0.99 quantiles, and divided it by 1000 for millisecond values.
Conclusion
There is no magic here, monitoring the four golden signals or the RED metrics is easy with modern tools like Prometheus and Grafana and you really need it because without it you’re flying blind. So the next time you will develop any service, just add some instrumentation – be nice and cultivate at least some operational sympathy for great good.